

11 posts in total · Page 1/2
-
 05 October 2026 · Yapay Zeka Enstitüsü
What Is RAG? AI That Works with Your Company Documents
Language models do not know your company’s contracts, product manuals or internal procedures. RAG is the method of having the model read the right document before it answers.
-
 29 September 2026 · Yapay Zeka Enstitüsü
Data Analyst or Data Scientist? The Differences and Which Suits You
Both roles work with data, but they ask different questions: the analyst asks "what happened?", the data scientist asks "what will happen?".
-
 22 September 2026 · Yapay Zeka Enstitüsü
What Is an AI Agent? How It Differs from a Chatbot
A chatbot answers a question. An agent takes a goal, decides which steps are needed and does the work itself by using tools.
-
 15 September 2026 · Yapay Zeka Enstitüsü
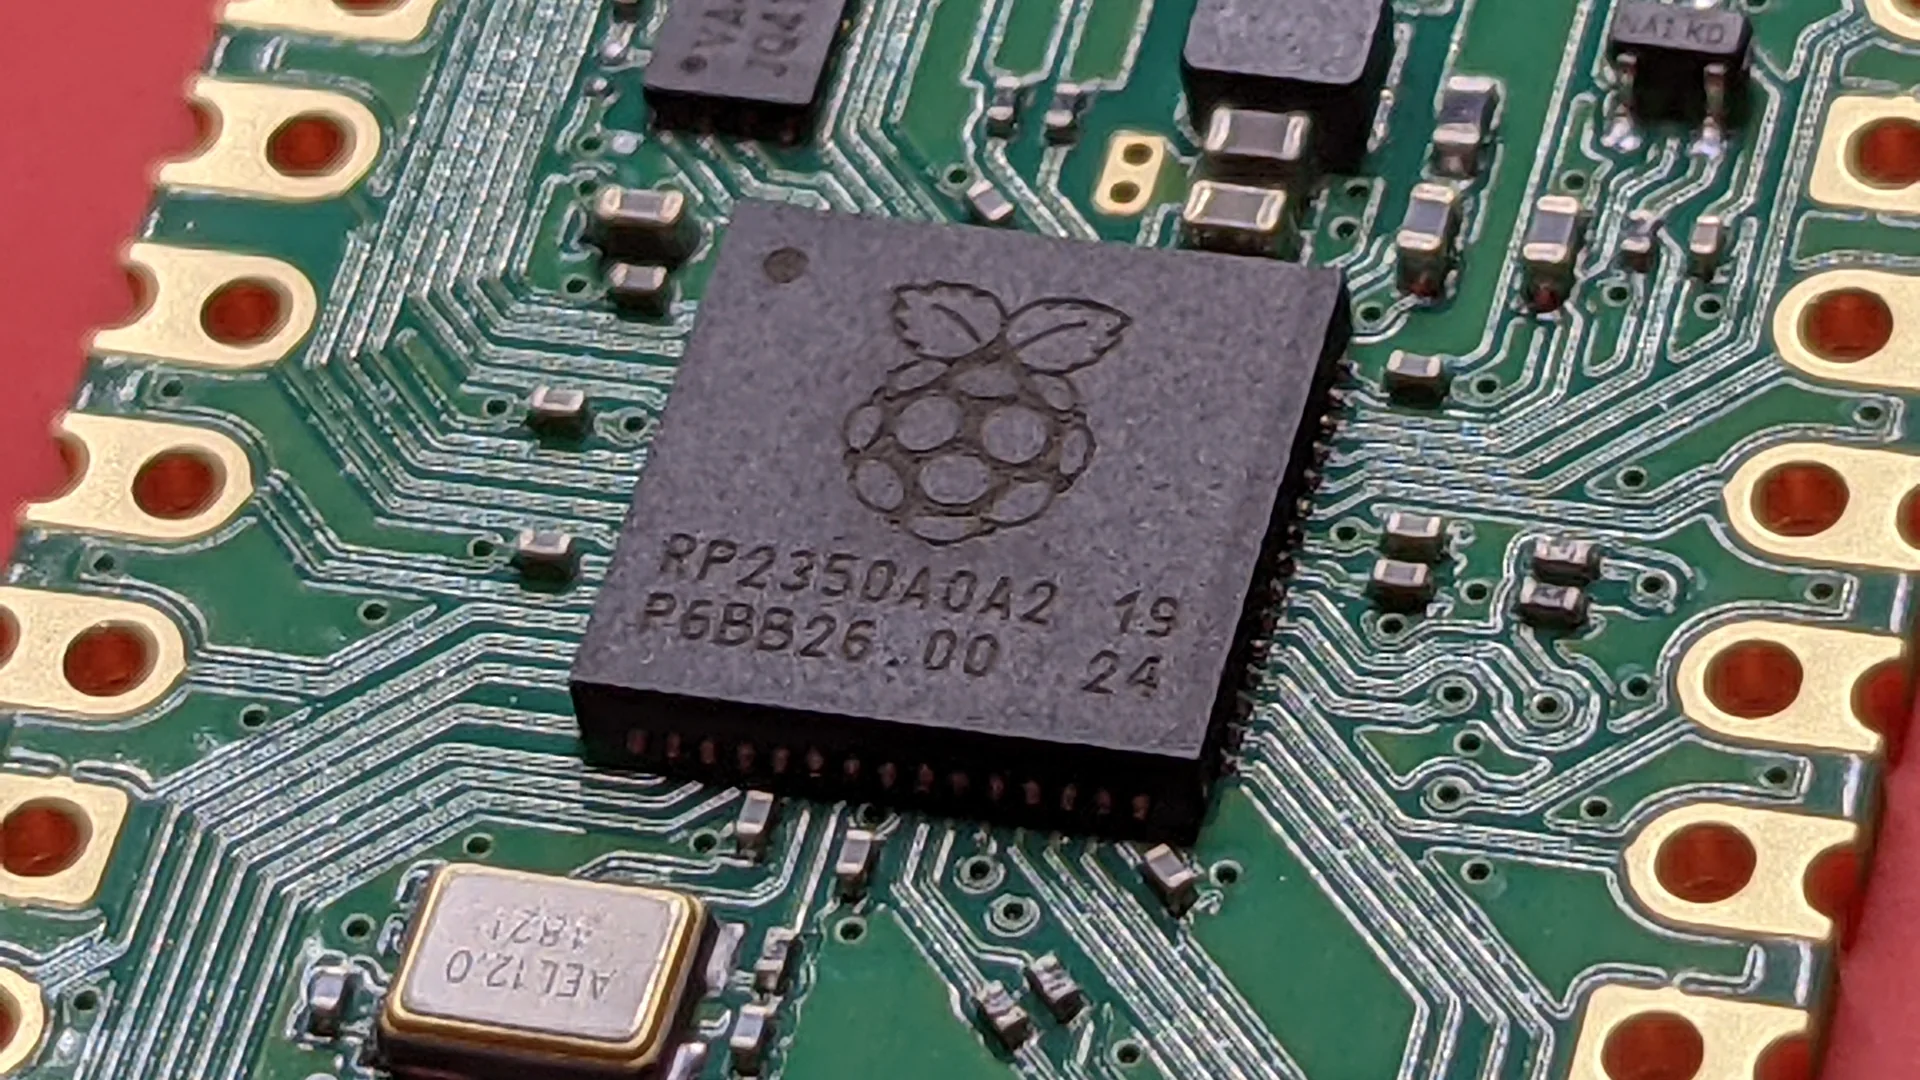
Machine Learning or Deep Learning? The Differences and Where to Start
The two terms are often used interchangeably, but they are not the same thing. Knowing the difference tells you which method fits which problem.
-
 08 September 2026 · Yapay Zeka Enstitüsü
What Is Prompt Engineering? How to Write a Good Prompt
The same AI model gives very different results depending on how you ask. Prompt engineering is how you stop leaving that difference to chance.
-
 01 September 2026 · Yapay Zeka Enstitüsü
What Is an LLM? How Large Language Models Work
Behind tools like ChatGPT, Gemini and Claude is the same idea: a very large model that has learned to predict the next word.
-
 25 August 2026 · Yapay Zeka Enstitüsü
What Is n8n? The Automation Tool That Connects Your Apps
Adding a row to a sheet, messaging the team and emailing the customer when a form is filled in: n8n lets you build chains like this visually.
-
 18 August 2026 · Yapay Zeka Enstitüsü
Why Do AI Projects Stall?
Most AI projects stall not because the model falls short, but because of a badly chosen problem, data that is not ready, or a lack of ownership.
-
 11 August 2026 · Yapay Zeka Enstitüsü
Your First Power BI Dashboard: What to Watch For
A good dashboard answers the viewer’s question in a few seconds. The way to get there is not adding more charts but deciding what not to show.